Grokking Algorithms - Chapter 12
K-Nearest Neighbor
K-nearest neighbor, or simply KNN, is a classification algorithm. Whenever we are given a set of data, given the unique attributes of that dataset, we can plot it on a graph. Like most things from this text, it’s something best understood visually. Let’s use one of the most common examples, classifying fruit;
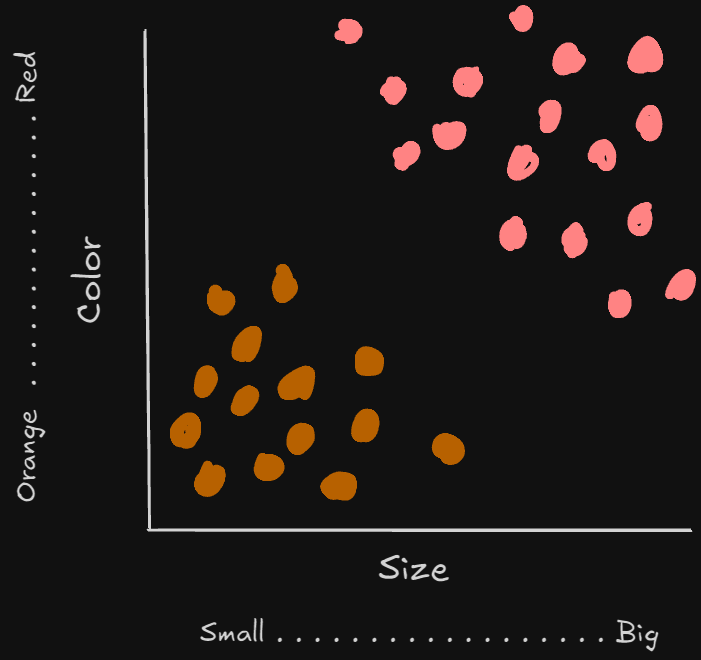
In the above example, the orange marks indicate an orange, and the red marks indicate an apple. Now, we could use this graph to classify the next fruit I get. If I find a place to put it, we can look at that new point’s neighbors to classify what kind of fruit it must be.
The K in KNN means you determines the number of neighbors you’ll be using as a classifying metric. For example. we place a point in the near middle. If K=3, we look at the three closest neighbors. If those 3 happen to be oranges, we have a good chance of our new fruit actually being an orange.
The classifying metrics mentioned above are the size and color of the fruit. We call these metrics features, and the features chosen dictates our classification. We can actually determine the distance between points using the following formula; $\sqrt{(x_1-x_2)^2+(y_1-y_2)^2}$ . This will compare against just two features.
This system is actually how Netflix runs their recommendation system. Users will rate movies on a scale, and are given a movie recommendation based on other users ratings that are similar. We can tell how close two user’s taste are by comparing their ratings as features;
| Pri | JT | Morpheus | |
|---|---|---|---|
| Comedy | 3 | 4 | 2 |
| Action | 4 | 3 | 5 |
| Drama | 4 | 5 | 1 |
| Horror | 1 | 1 | 3 |
| Romance | 4 | 5 | 1 |
| Now that we have five features to test against, our formula changes slightly; $\sqrt{(a_1-a_2)^2+(b_1-b_2)^2+(c_1-c_2)^2+(d_1-d_2)^2+(e_1-e_2)^2}$. |
If we attempted to see how close the tastes are between two Pri and JT, it would look like this:
- $\sqrt{(3-4)^2+(4-3)^2+(4-5)^2+(1-1)^2+(4-5)^2}$
- $\sqrt{1+1+1+0+1}$
- $\sqrt{4}$
- 2 –> Our Answer!
Now, we can compare this answer by comparing the tastes of Pri and Morpheus:
- $\sqrt{(3-2)^2+(4-5)^2+(4-1)^2+(1-3)^2+(4-1)^2}$
- $\sqrt{1+1+9+4+9}$
- $\sqrt{24}$ –> Our Answer!
Clearly, given the results, Pri and JT have more in common than Pri and Morpheus.
Exercises
- If two users are using the same scale with different meanings (Ex. both use 1-5, but one user only rates 1 or 5, and the other uses all five options). How could you compare both?
Use the average of both users ratings!
- Suppose some users ratings matter more than others. How could you edit the rating formula to account for this?
Using weights (count the special ratings more than once)
Regression
If you wanted to say, predict how Pri will rate the next movie she sees, you would want to use a Regression. Regressions make predictions based on other users’ rating of the same movie with similar tastes as Pri. We would take all the other user ratings collect an average, which we can use to predict how Pri will rate it.
Another example, what if we wanted to prepare a bakery for a day of work? This bakery has three determining factors for how much it will sell; the weather (scale of 1 to 5), whether it’s a weekend or holiday (1 if so, 0 otherwise) and if there is a sports game on to watch (1 for yes, 0 for no). The bakery kept track of the amount of loaves based on the above features six times;
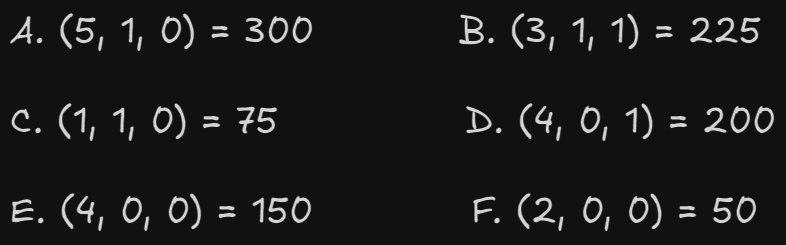
With this information, we’d have to compare each feature just like we did before if we wanted to predict today’s bread count. Today’s features are (4, 1, 0).
A
- $\sqrt{(5-4)^2+(1-1)^2+(0-0)^2}$
- $\sqrt{1+0+0}$
- $\sqrt{1}$
- 1 –> Our Answer!
B
- $\sqrt{(3-4)^2+(1-1)^2+(1-0)^2}$
- $\sqrt{1+0+1}$
- $\sqrt{2}$ –> Our Answer!
C
- $\sqrt{(1-4)^2+(1-1)^2+(0-0)^2}$
- $\sqrt{9+0+0}$
- $\sqrt{9}$ –> Our Answer!
D
- $\sqrt{(4-4)^2+(0-1)^2+(1-0)^2}$
- $\sqrt{0+1+1}$
- $\sqrt{2}$ –> Our Answer!
E
- $\sqrt{(4-4)^2+(0-1)^2+(0-0)^2}$
- $\sqrt{0+1+0}$
- $\sqrt{1}$
- $1$ –> Our Answer!
F
- $\sqrt{(2-4)^2+(0-1)^2+(0-0)^2}$
- $\sqrt{4+1+0}$
- $\sqrt{5}$ –> Our Answer!
The closest answers are A, B, D, and E. If we calculate up the loaves made on these days, and get an average, we get 218.75 loaves. We should probably make around 220 loaves, just to be safe.
As we can see, the features being accurate matters a lot. So, how do we pick good features? Great question; for one, they should correlate with what you’re looking to predict. If you are looking to predict bread loaf sales for the day, an irrelevant factor would be what you had for breakfast, or what TV show you last watched.
Another is that they should be free of bias. Think of someone trying to predict how audiences will react to a new comedy special they are making. A bad idea would be to collect information from people who only like comedy, as they are more likely to say yes than others whom you know may not prefer or like comedy specials.
Introduction to Machine Learning
This text only briefly spends time on it, but it does introduce the most common/relevant topics you are likely to find in any Machine Learning specific text. This section and the next chapter cover introductions to a few different Machine Learning algorithms.
OCR
Optical Character Recognition, or OCR, is a common introduction to see exactly how machine learning works. OCR allows for the transfer of text through images. KNN is used to go through images and extract features, adding to the grid based on each newly discovered feature.
Feature extraction is what that’s called, and is the first step. Once all relevant features have been extracted, training. A model is trained on the images and the features within those images to recognize features within newly introduced data points. Often, you’ll have to parameter tune by moving the value of K up and down until desired results are obtained.
Next: Chapter 13